

Salesforce Opportunity Dashboard
Track open opportunities, won and expected revenue, and more.


This Salesforce opportunity dashboard provides an overview of a company’s sales outlook. With this information, leaders can answer the following questions:
- Firstly, how many opportunities are open?
- Secondly, what is our monthly conversion rate?
- Thirdly, how much revenue have we won? Further, how much is expected?
- Finally, what stages are our active opportunities in?
Review Key Sales Figures
With the card widgets at the top of the dashboard, sales leaders can quickly see key figures such as the number of open opportunities, closed won revenue, expected revenue, and the team’s monthly conversion rate.
Then, two of the dashboard’s widgets offer insight into open and closed opportunities by stage. Firstly, the Closed Opportunities by Stage doughnut chart shows the percentage of closed opportunities in each stage. Similarly, the Active Opportunities Revenue by Stage bar graph displays the revenue represented by opportunities in each active stage.
The top 10 won and open opportunity charts allow leaders to see the team’s most lucrative closed and open sales. Finally, the bar graph in the bottom row of the dashboard displays the lead sources for open opportunities.
This data is critical for sales leaders who want to stay on top of every opportunity, close more business, and analyze the most fruitful lead sources for their teams.
Access live 30-minute demo with our experts
Sales Dashboard Examples

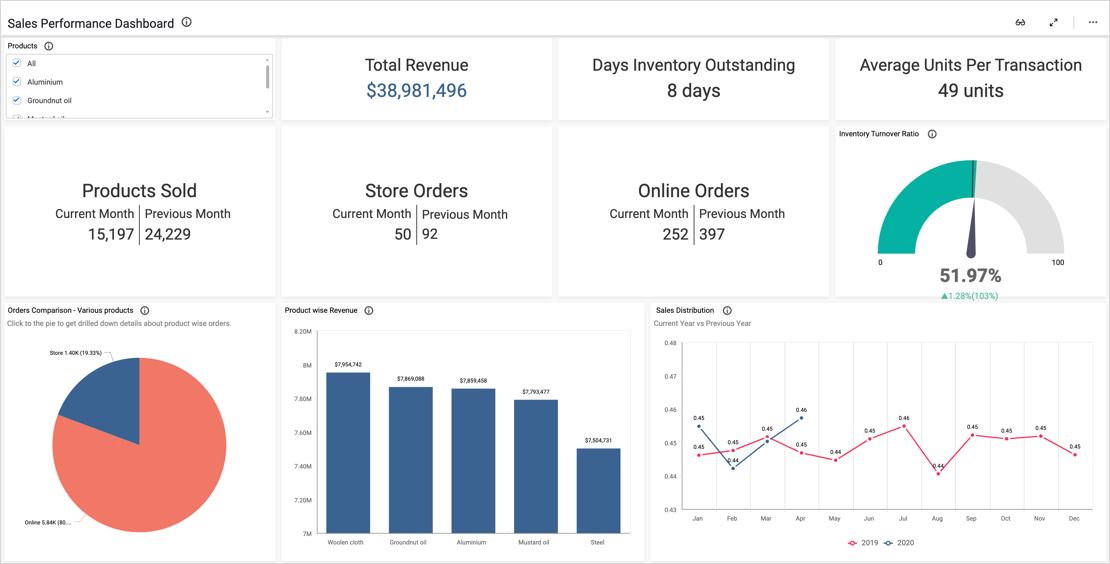
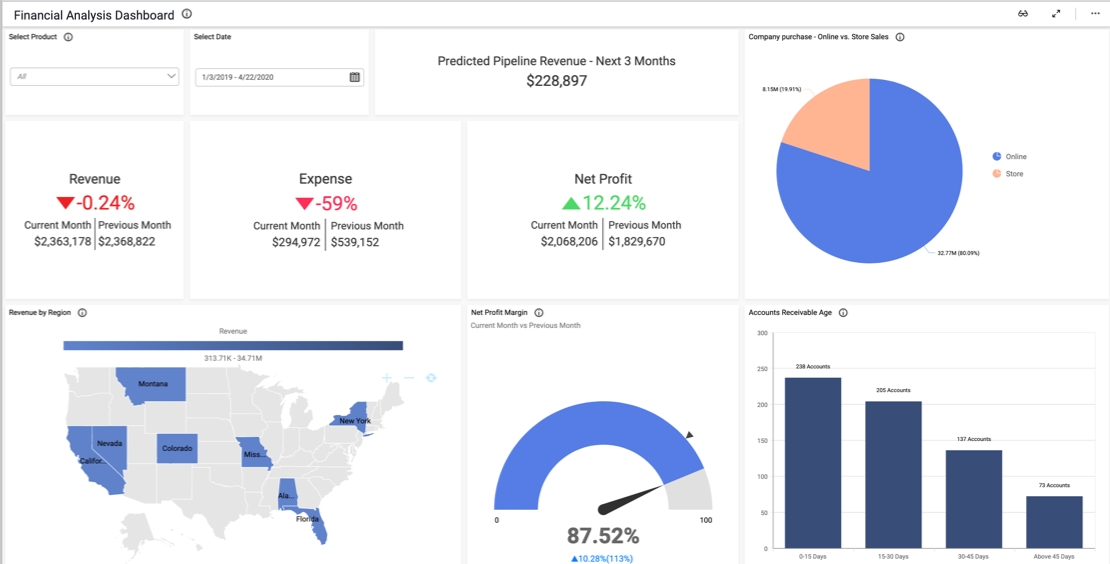
Smart Dashboard’s sales performance dashboard provides a detailed breakdown of key data sets.

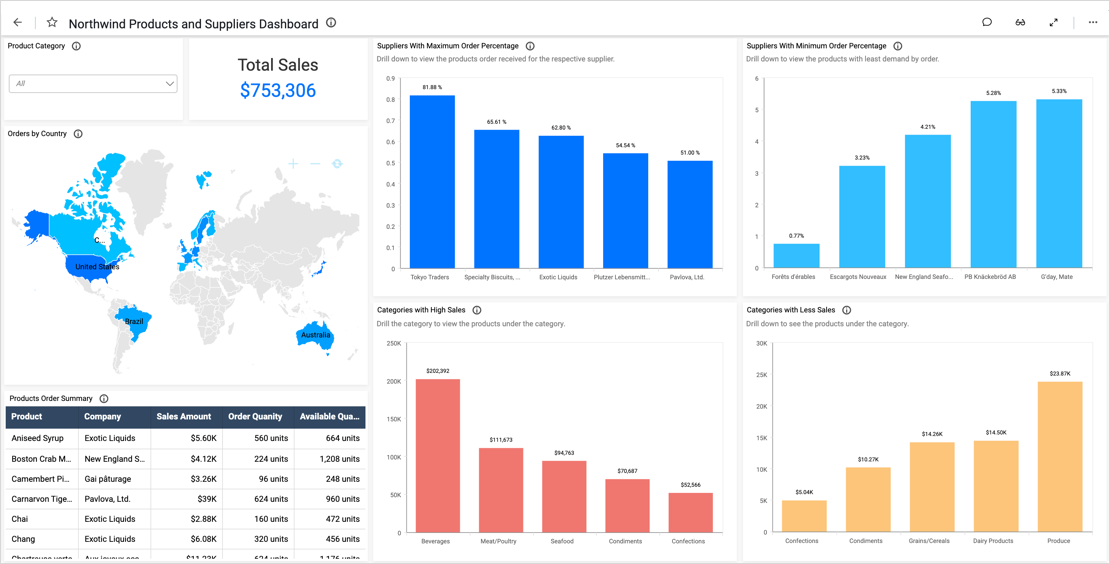
This sales dashboard lists orders placed with the fictitious supply company Northwind Traders.


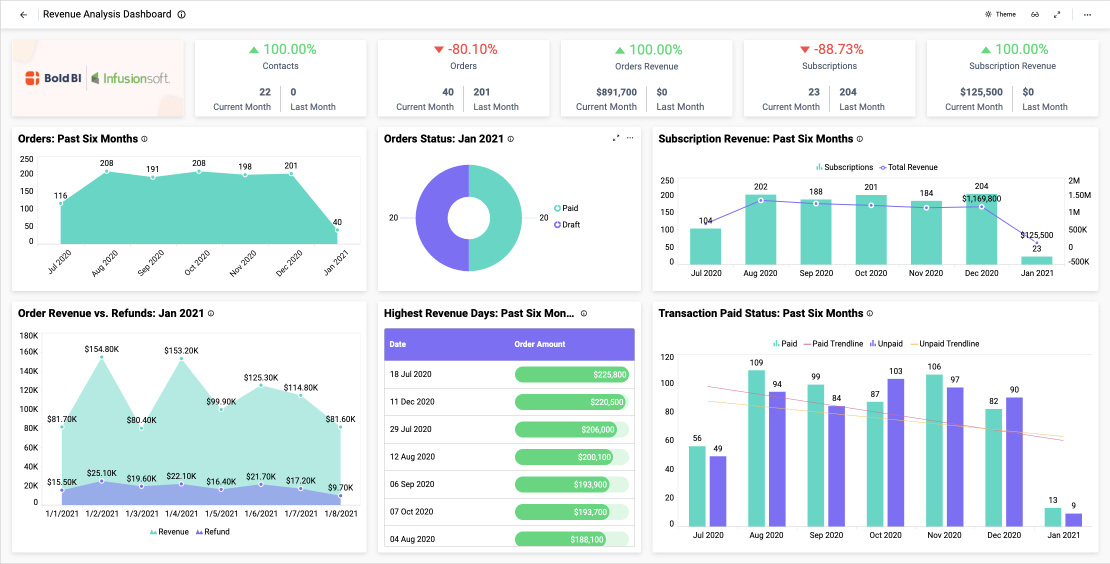
This Infusionsoft dashboard provides a detailed breakdown of a company’s recent orders.

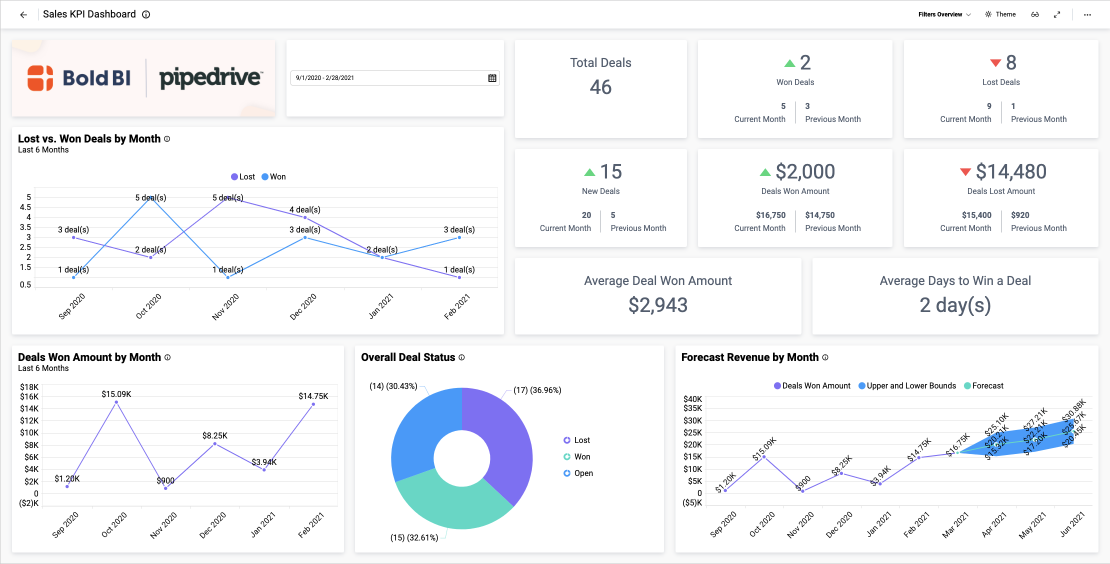
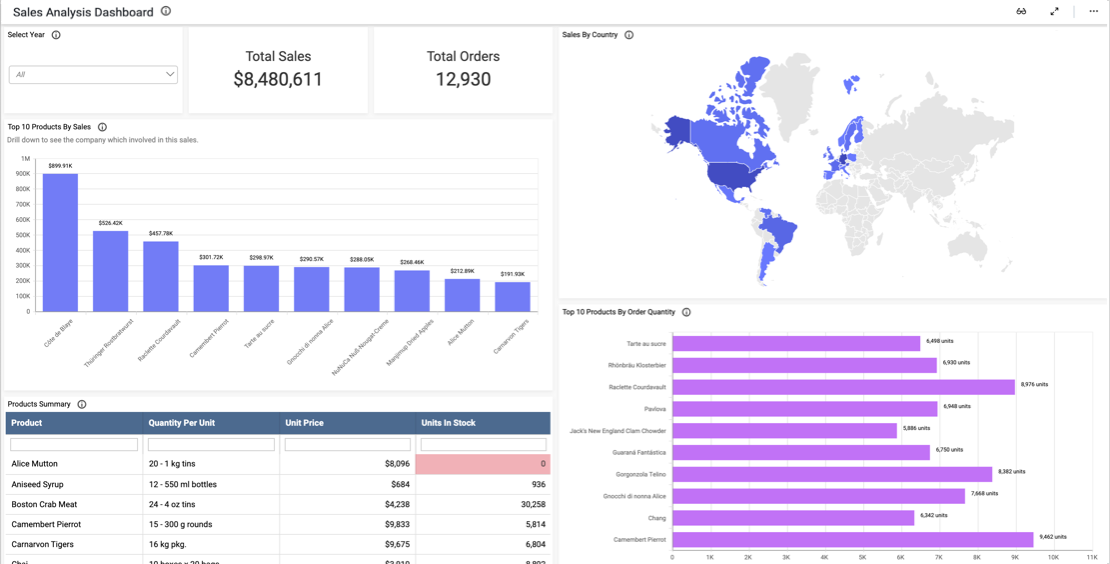
This sales KPI dashboard provides a detailed breakdown of a company’s key metrics.
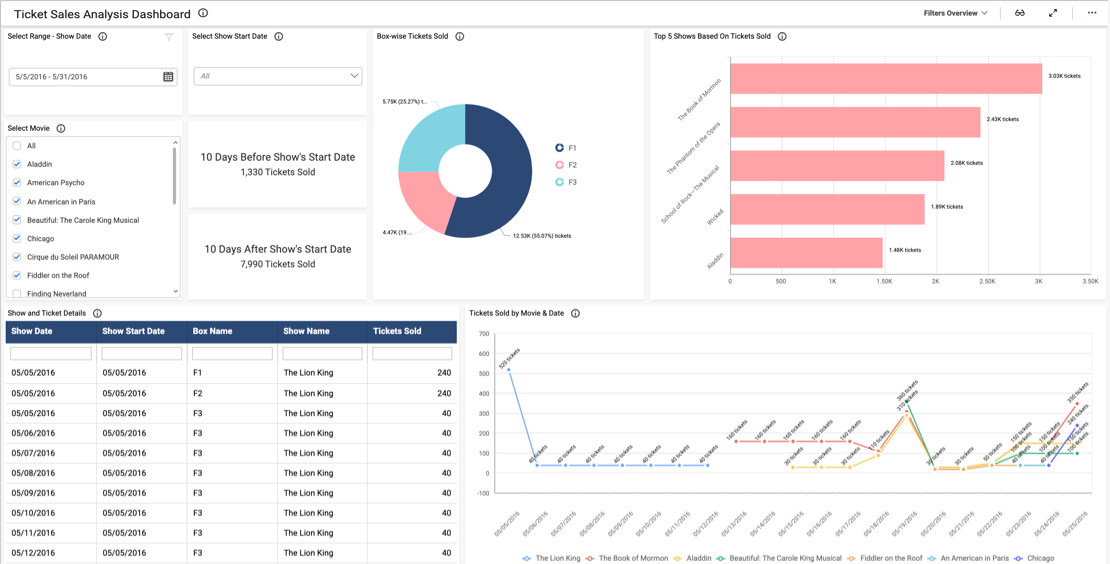
This sales activity tracker dashboard displays key data sets relating to ticket sales.

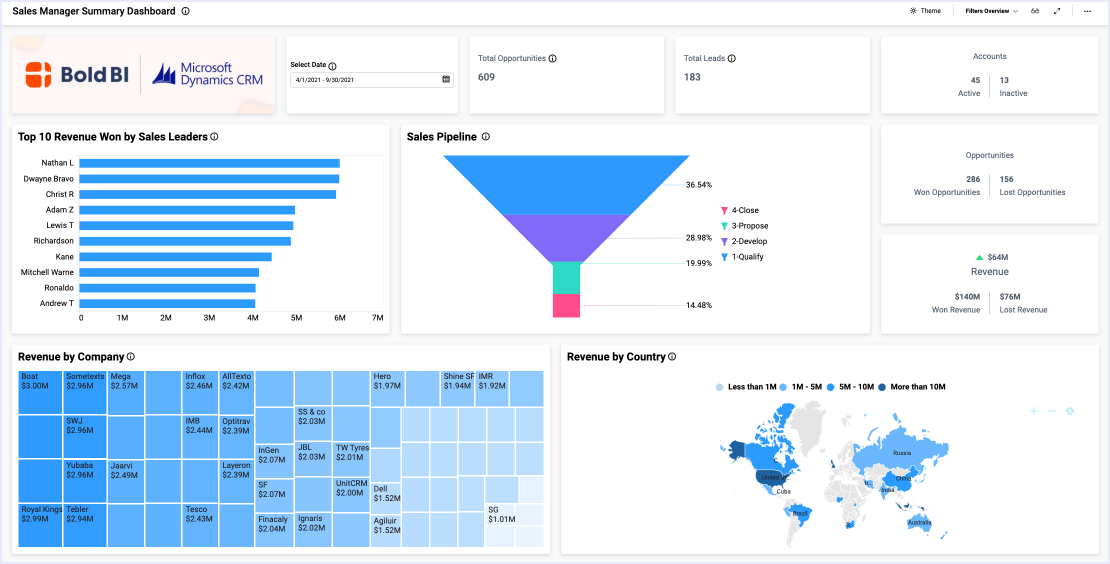
This sales manager summary dashboard provides a detailed breakdown of a company’s revenue details, leads, and sales pipeline. With this dashboard…
This sales leads tracking dashboard provides a detailed breakdown of a company’s lead and account details. With this dashboard…

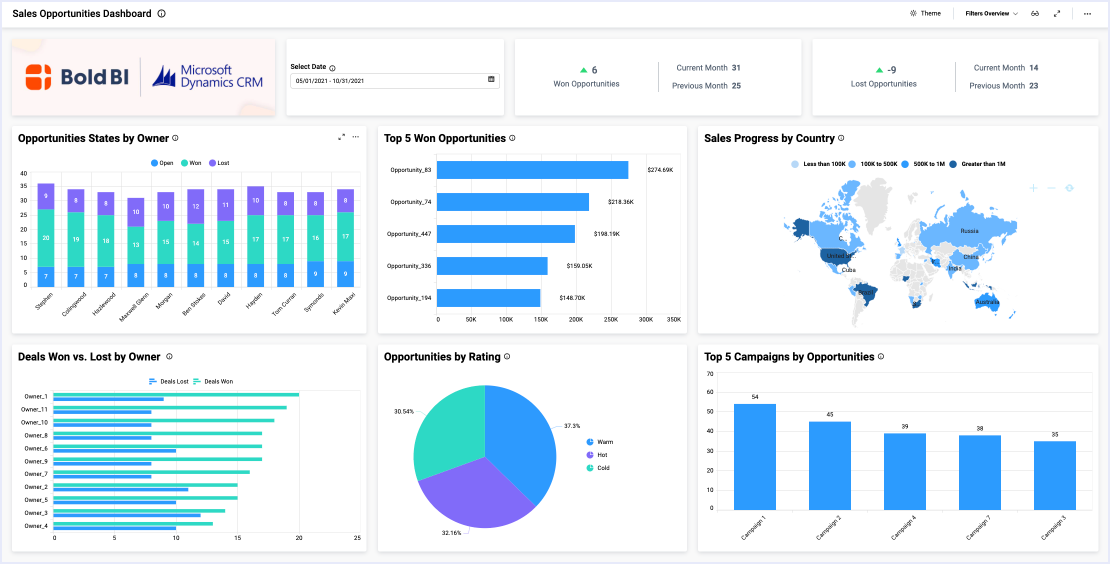
This sales opportunities dashboard provides a detailed breakdown of a company’s opportunities and revenue. With this dashboard…


This sales activities tracker dashboard provides a detailed breakdown of a sales team’s work. With this dashboard, we can answer…
View Other Solutions
In the information technology field, you need to be able to monitor everything…

